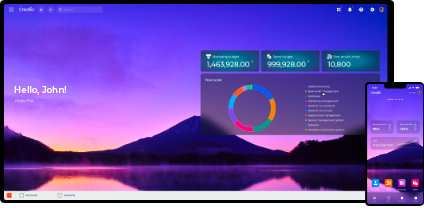
Dashboard set-up
Make sure your goals are achieved by easily planning sales volumes by account managers, bank products or services. Get relevant statistics or selected Indicators (for example, the number of bank’s customers in a region or industry) displayed as graphical charts, create lists of the most important information and track your results. Compare indicators across periods, apply smart filtering tools to get the information you need within a matter of seconds and analyze results.

Sales reps’ dashboards
Bank sales reps can get a 360-degree view of their efficiency on a consolidated dashboard. Dashboards help them to evaluate key KPIs and track revenue per consultant, per department, per bank service etc.


