


The Guide to TAM SAM SOM: Definition and How to Calculate Them


Launching a new product always comes with a bit of gamble. Questions like "What if it doesn't take off?" or "What if no one buys it?" are common worries for startups and new companies. Luckily, you don’t have to leave it all to chance; you can reduce these risks by figuring out the TAM, SAM, and SOM for your business idea.
Working out TAM, SAM, and SOM is incredibly useful at different points in your company's journey. For startups, these figures set benchmarks for success and help attract investors. For established companies, they’re key for assessing new ideas and deciding where to allocate resources. Plus, market sizing research can often uncover new opportunities or directions for your business.
But watch out, there are loads of pitfalls and misconceptions when calculating and applying TAM, SAM, and SOM. This guide ensures your calculations are spot on and that you see these figures to your advantage. Let's dive in!
What is TAM SAM SOM?
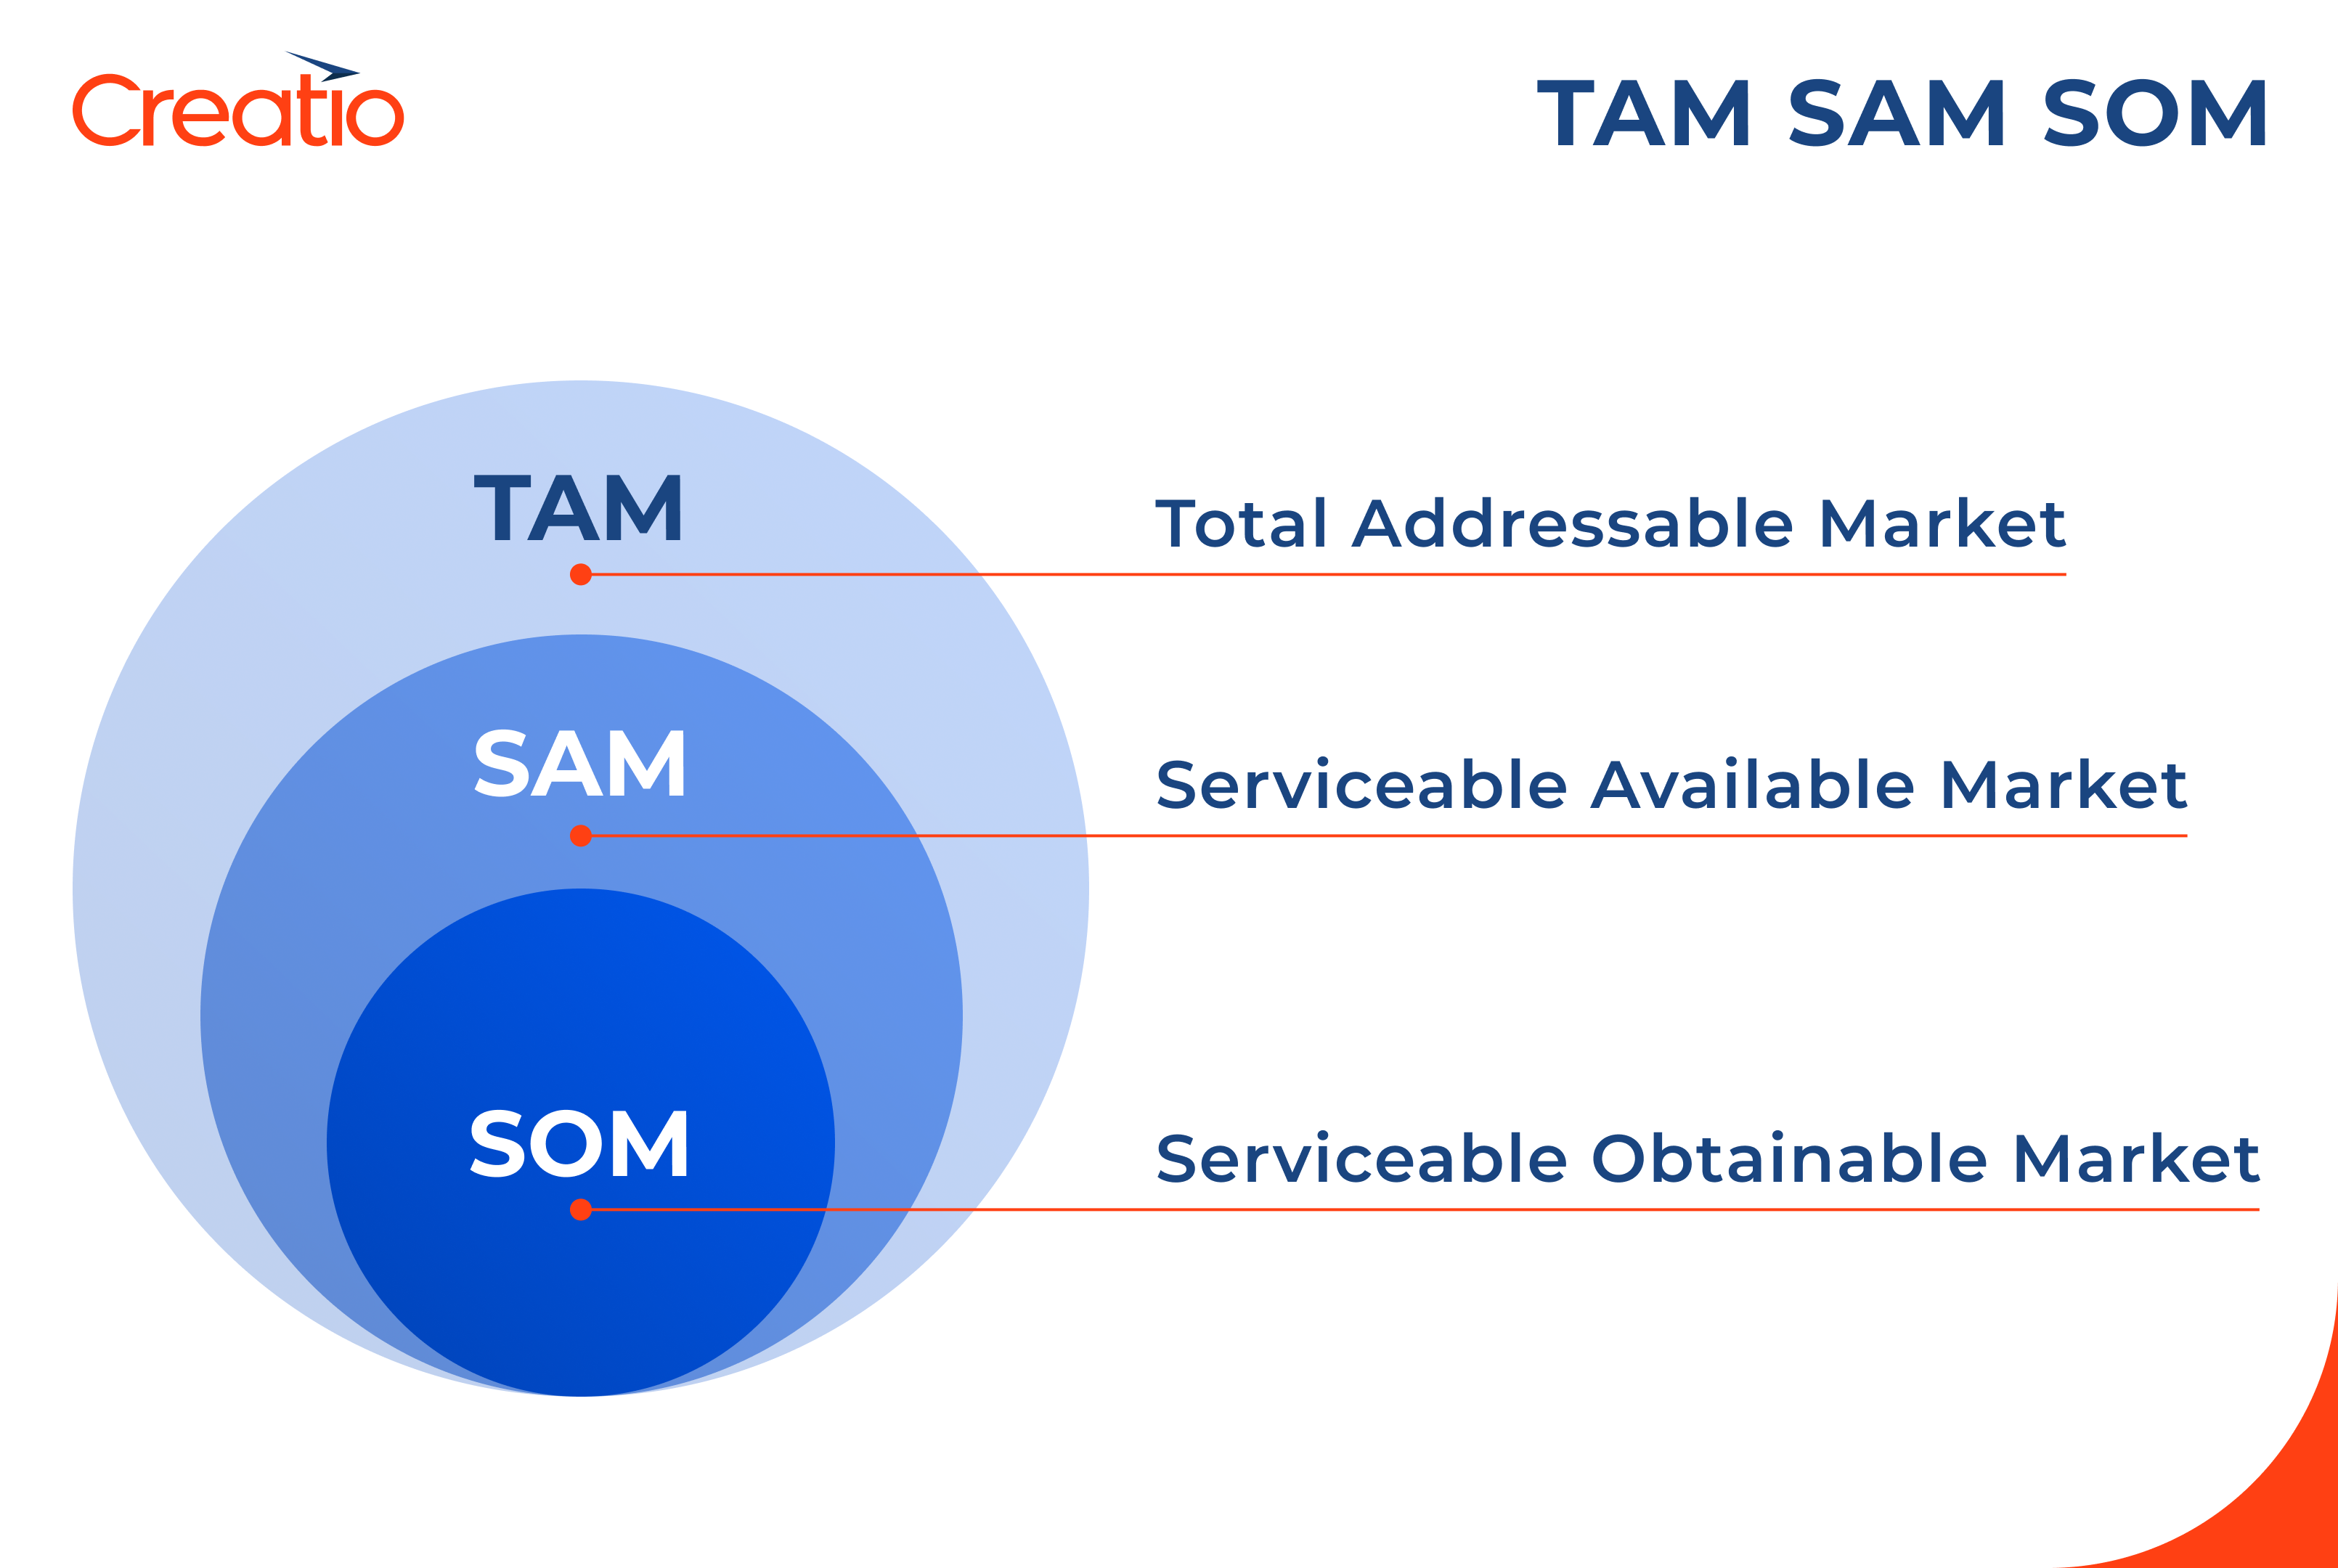
TAM, SAM, and SOM are acronyms that stand for metrics describing the market size for your new product. They help you estimate the total market size, the accessible market, and the target market, giving you a clearer picture of potential market share and revenue.
The process of conducting market research and working out TAM, SAM, and SOM is what we call market sizing.
TAM (Total Addressable Market)
Total Addressable Market (TAM) is the broadest possible market for your product, covering all potential customers without considering limitations such as location, product specifics, or budget. This metric represents the total revenue you could achieve if you captured 100% of this market.
For example, if you were opening a hairdressing salon, figuring out your TAM would mean counting everyone in the world who uses hairdressing services. But this wouldn’t take into account things like a) your salon not being in every city, or b) the fact that potential customers are already going to other hairdressers.
TAM is handy for understanding the potential size of your business and starting to shape your go-to-market strategy. But it’s not very realistic. No matter how well you run your business or how much people love your product, you’ll never reach the TAM figure, as it assumes you’re the only provider with no competition.
SAM (Serviceable Addressable Market)
Serviceable Addressable Market (SAM) is the part of the Total Addressable Market (TAM) that your product or service can realistically cover. While TAM is the big picture and doesn't consider specifics like location or product details, SAM focuses on the market you can actually get to and those genuinely interested in what you offer.
Let's go back to the hair salon example. Your TAM is huge, but once you narrow it down to the city in which you're operating and the type salon you’re running, you get a more realistic SAM. For example, if you’re planning to open a salon for people with curly hair in Melbourne, your SAM will be much smaller.
SOM (Serviceable Obtainable Market)
Lastly, SOM (Serviceable Obtainable Market) represents the actual portion of the market you can grab with your current resources and strategy. This metric focuses on what you can realistically achieve based on the tools and capabilities you’ve got. To size up your SOM, think about these factors:
- Your product, its niche, and its Unique Value Proposition (UVP)
- Your go-to-market strategy and distribution channels
- Your production capacity – you can't meet demand if you don't have enough products
- Your SAM and the level of market saturation
- Customer behaviour – how keen they are to jump on board with your product and switch from other brands
While TAM and SAM are usually figured out before you get going and launch your idea, SOM can only be worked out after you’re entering the market, as its calculation needs operational data (more on that later). Even so, it is important for forecasting your success and growth.
TAM vs SAM vs SOM: Key Differences
TAM | SAM | SOM | |
| The goal | Get a handle on the market’s potential and show the viability of the idea to investors. | Identify the reachable market and wisely allocate resources. | Set realistic business goals and track key performance indicators. |
| Scope | Broad, inclusive, and theoretical, looking at the entire market without any constraints. | More focused; considers the accessible and relevant market segments based on business capabilities. | Narrow and practical; considers the realistically obtainable market share within the accessible segments. |
| Use case | Evaluating a product idea, pitching investors, and scaling your business. | Developing a go-to-market strategy and analysing competitors. | Evaluating business performance and fine-tuning strategy for ongoing improvement. |
Why is TAM, SAM, and SOM Important for Your Business?
TAM, SAM, and SOM metrics often take centre stage in talks about investments and startups, but they’re crucial for any business, no matter where it’s at in its growth journey. Whether you’re brainstorming a fresh product idea or fine-tuning your go-to-market plan, these metrics are gold for spotting chances and refining your strategy.
Let's dig into how TAM, SAM, and SOM can amp up your business.
Understand your market potential
TAM, SAM, and SOM are key to understanding the potential revenue in a specific market, helping you decide if diving in is worth it. For example, a big difference between TAM/SAM and SOM may mean a tough market dominated by big fish, making it tricky to introduce your product and gaining customers.
Set business goals
TAM, SAM, and SOM help set benchmarks for your business to aim for. With TAM, you can set ambitious yet doable long-term goals. SAM lets you fine-tune these goals based on the portion of the market you can realistically handle, while SOM helps nail down short-term targets that match your current capabilities.
Discover growth opportunities
When you delve into TAM, SAM, and SOM, you might uncover new business prospects and potential pathways for your idea. For example, a business could spot an untapped niche within its SAM that could be seized with minor tweaks to its product lineup. Overall, crunching the numbers on TAM, SAM, and SOM sharpens your focus on market needs and shines a light on growth opportunities.
Fine-tune your go-to-market strategy
Once you've done the groundwork on TAM, SAM, and SOM, using these insights can seriously boost your go-to-market strategy. These metrics are crucial for guiding strategic decisions; for example, TAM gives you an overview of your market potential, SAM pinpoints the most promising target segments, and SOM ensures you’re aiming for achievable market share.
Moreover, evaluating TAM, SAM, and SOM can kickstart your competitor analysis, shaping both product development and marketing strategies. By understanding your target market’s size and characteristics, you can better size up your competitors and find ways to set your product apart.
Allocate resources efficiently
Getting a handle on your TAM, SAM, and SOM helps you allocate resources wisely. It lets you focus your efforts where they’ll pay off the most, while avoiding unnecessary spending in less promising areas.
For example, a company might ramp up spending on marketing and sales to boost brand recognition and grow its footprint in its SAM. Being proactive with these choices sets the stage for strong brand management right from the start.
Attract investors
Clear-cut TAM, SAM, and SOM metrics can boost investor confidence. They show you’ve got a solid grip on the market and a practical plan for taking advantage of opportunities, which is crucial for attracting funding.
Investors carefully assess TAM, SAM, and SOM to see a comprehensive TAM, a realistic SAM, and a solid SOM that signals promising potential.
As your business moves forward, revisiting TAM, SAM, and SOM helps uncover new growth prospects. It allows you to tap into new markets, fine-tune your strategy, and set new goals that match changes in the market.
How to Calculate TAM SAM SOM?
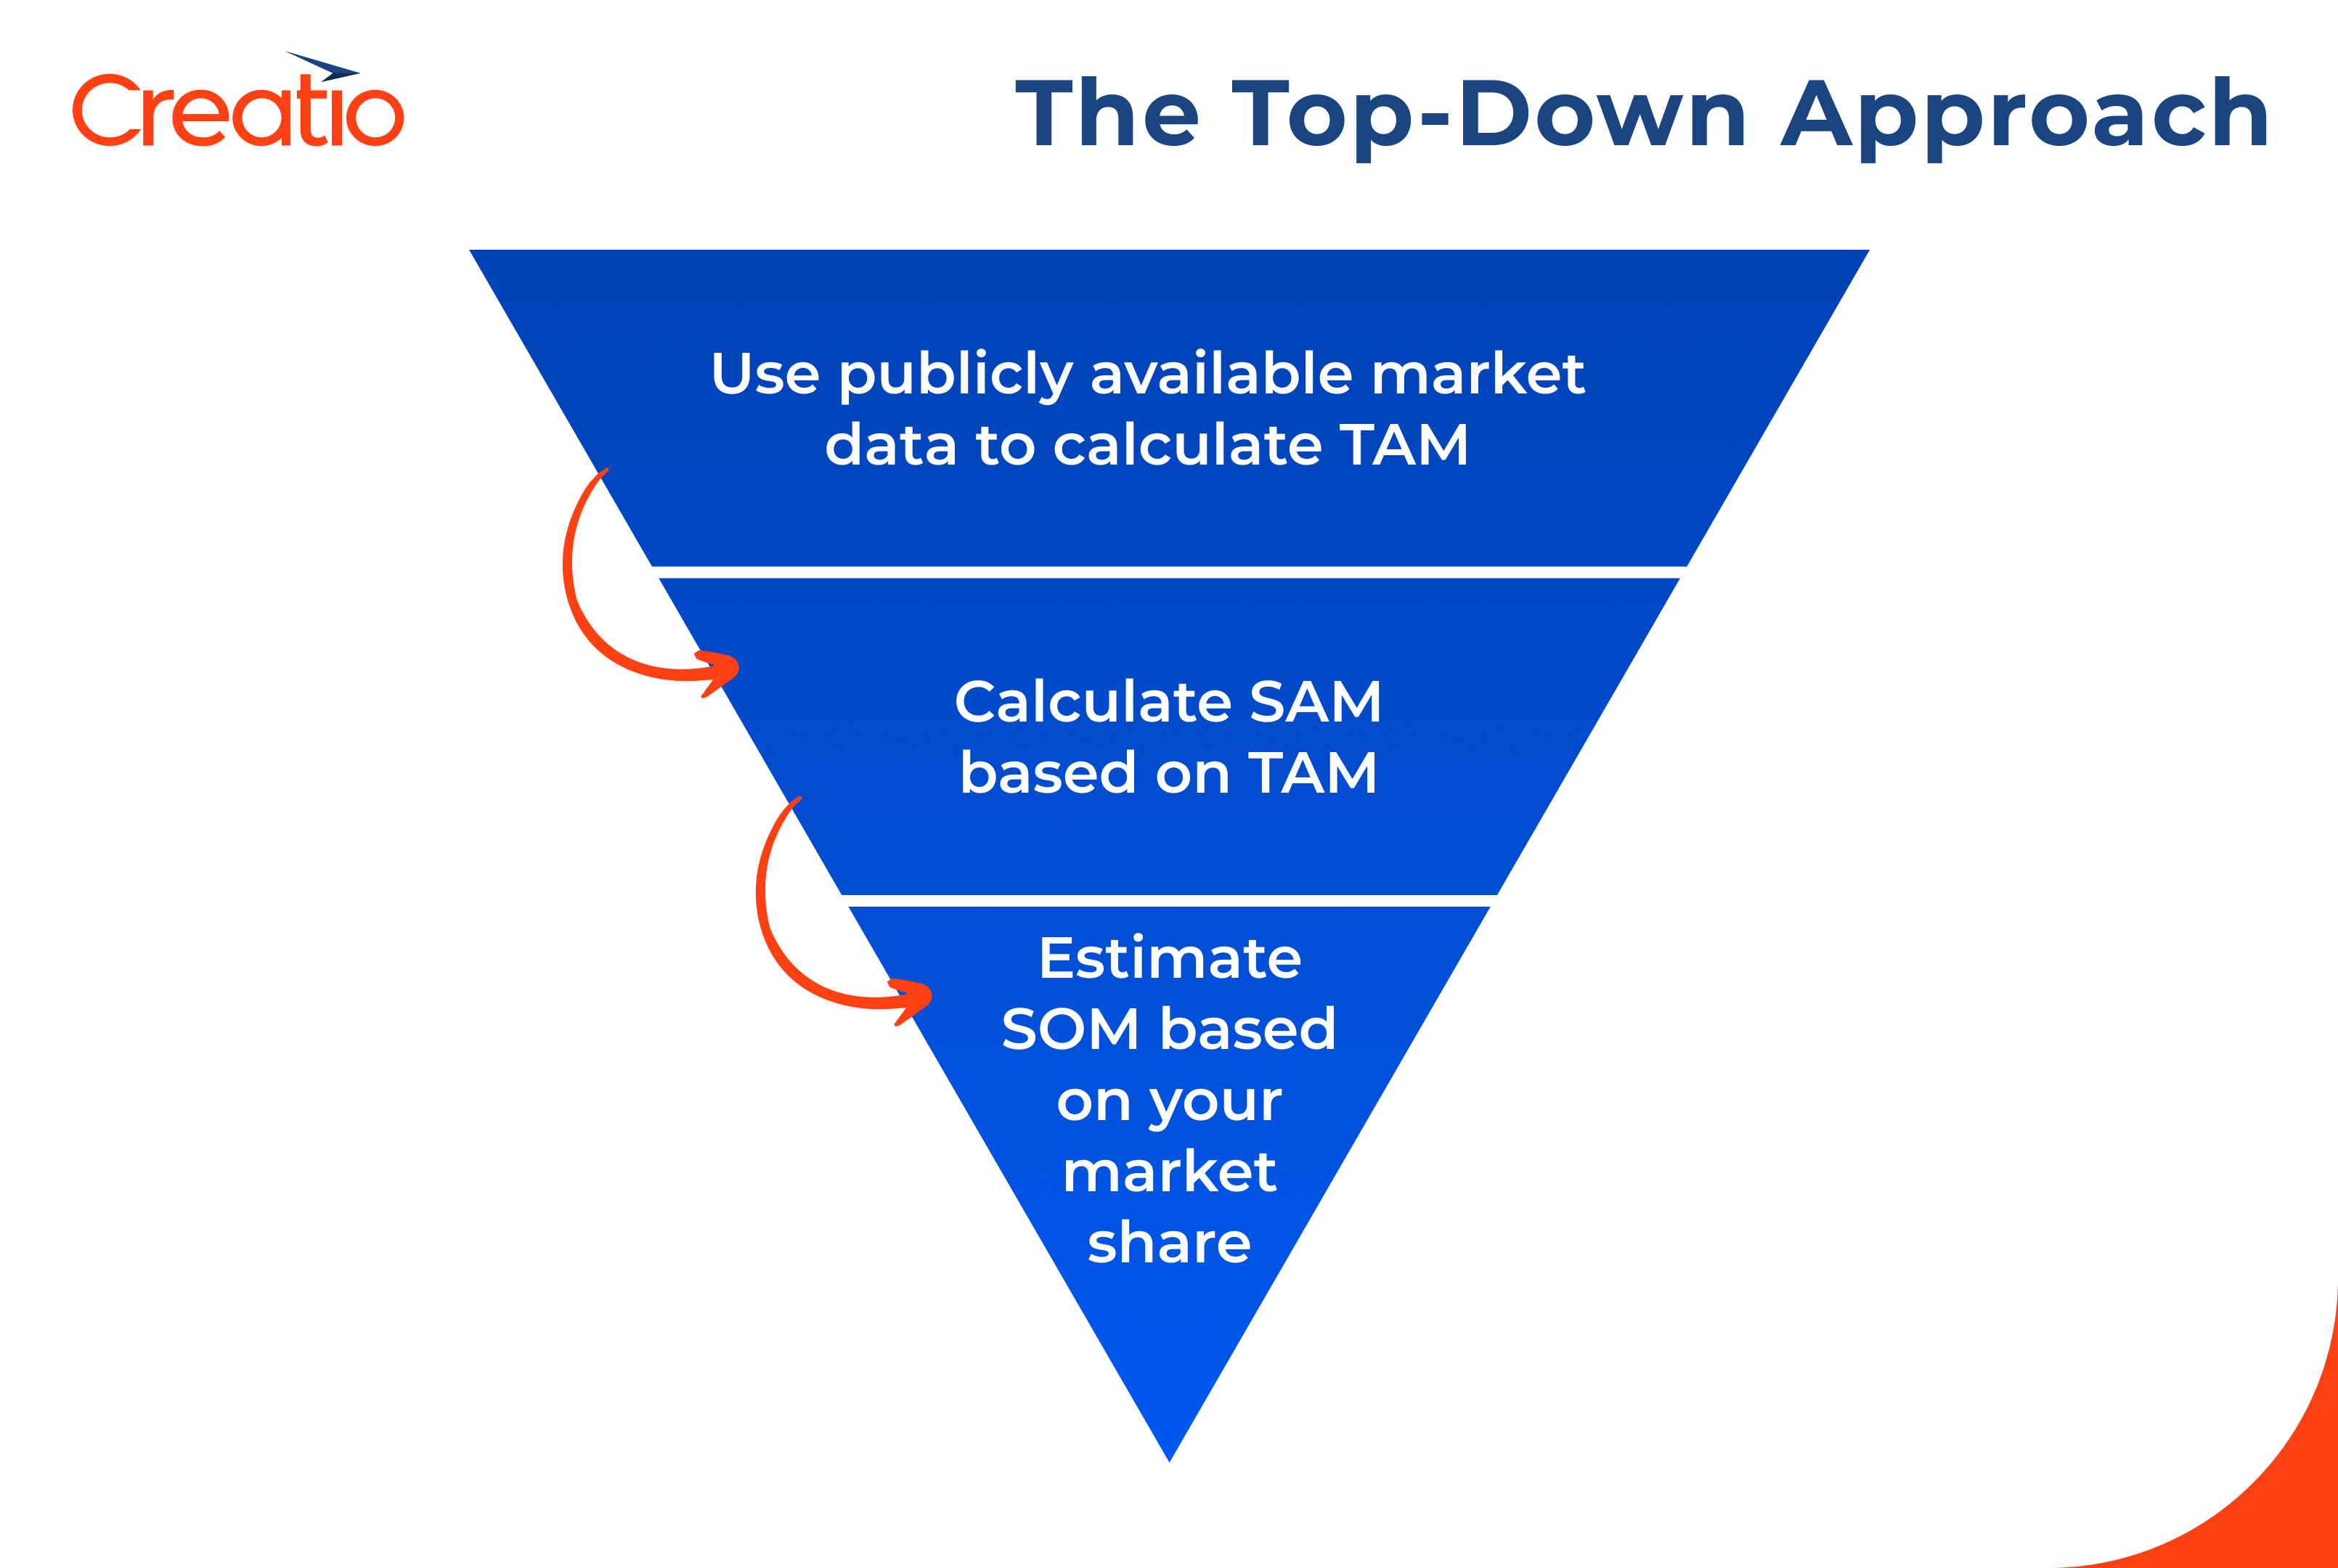
Calculating TAM and SAM typically involves two methods, depending on how you get your data. The first method uses publicly available research done by industry bigwigs like IDC or Gartner, known as the top-down approach. This market info from trusted sources helps you figure out TAM, which then helps work out SAM and SOM.
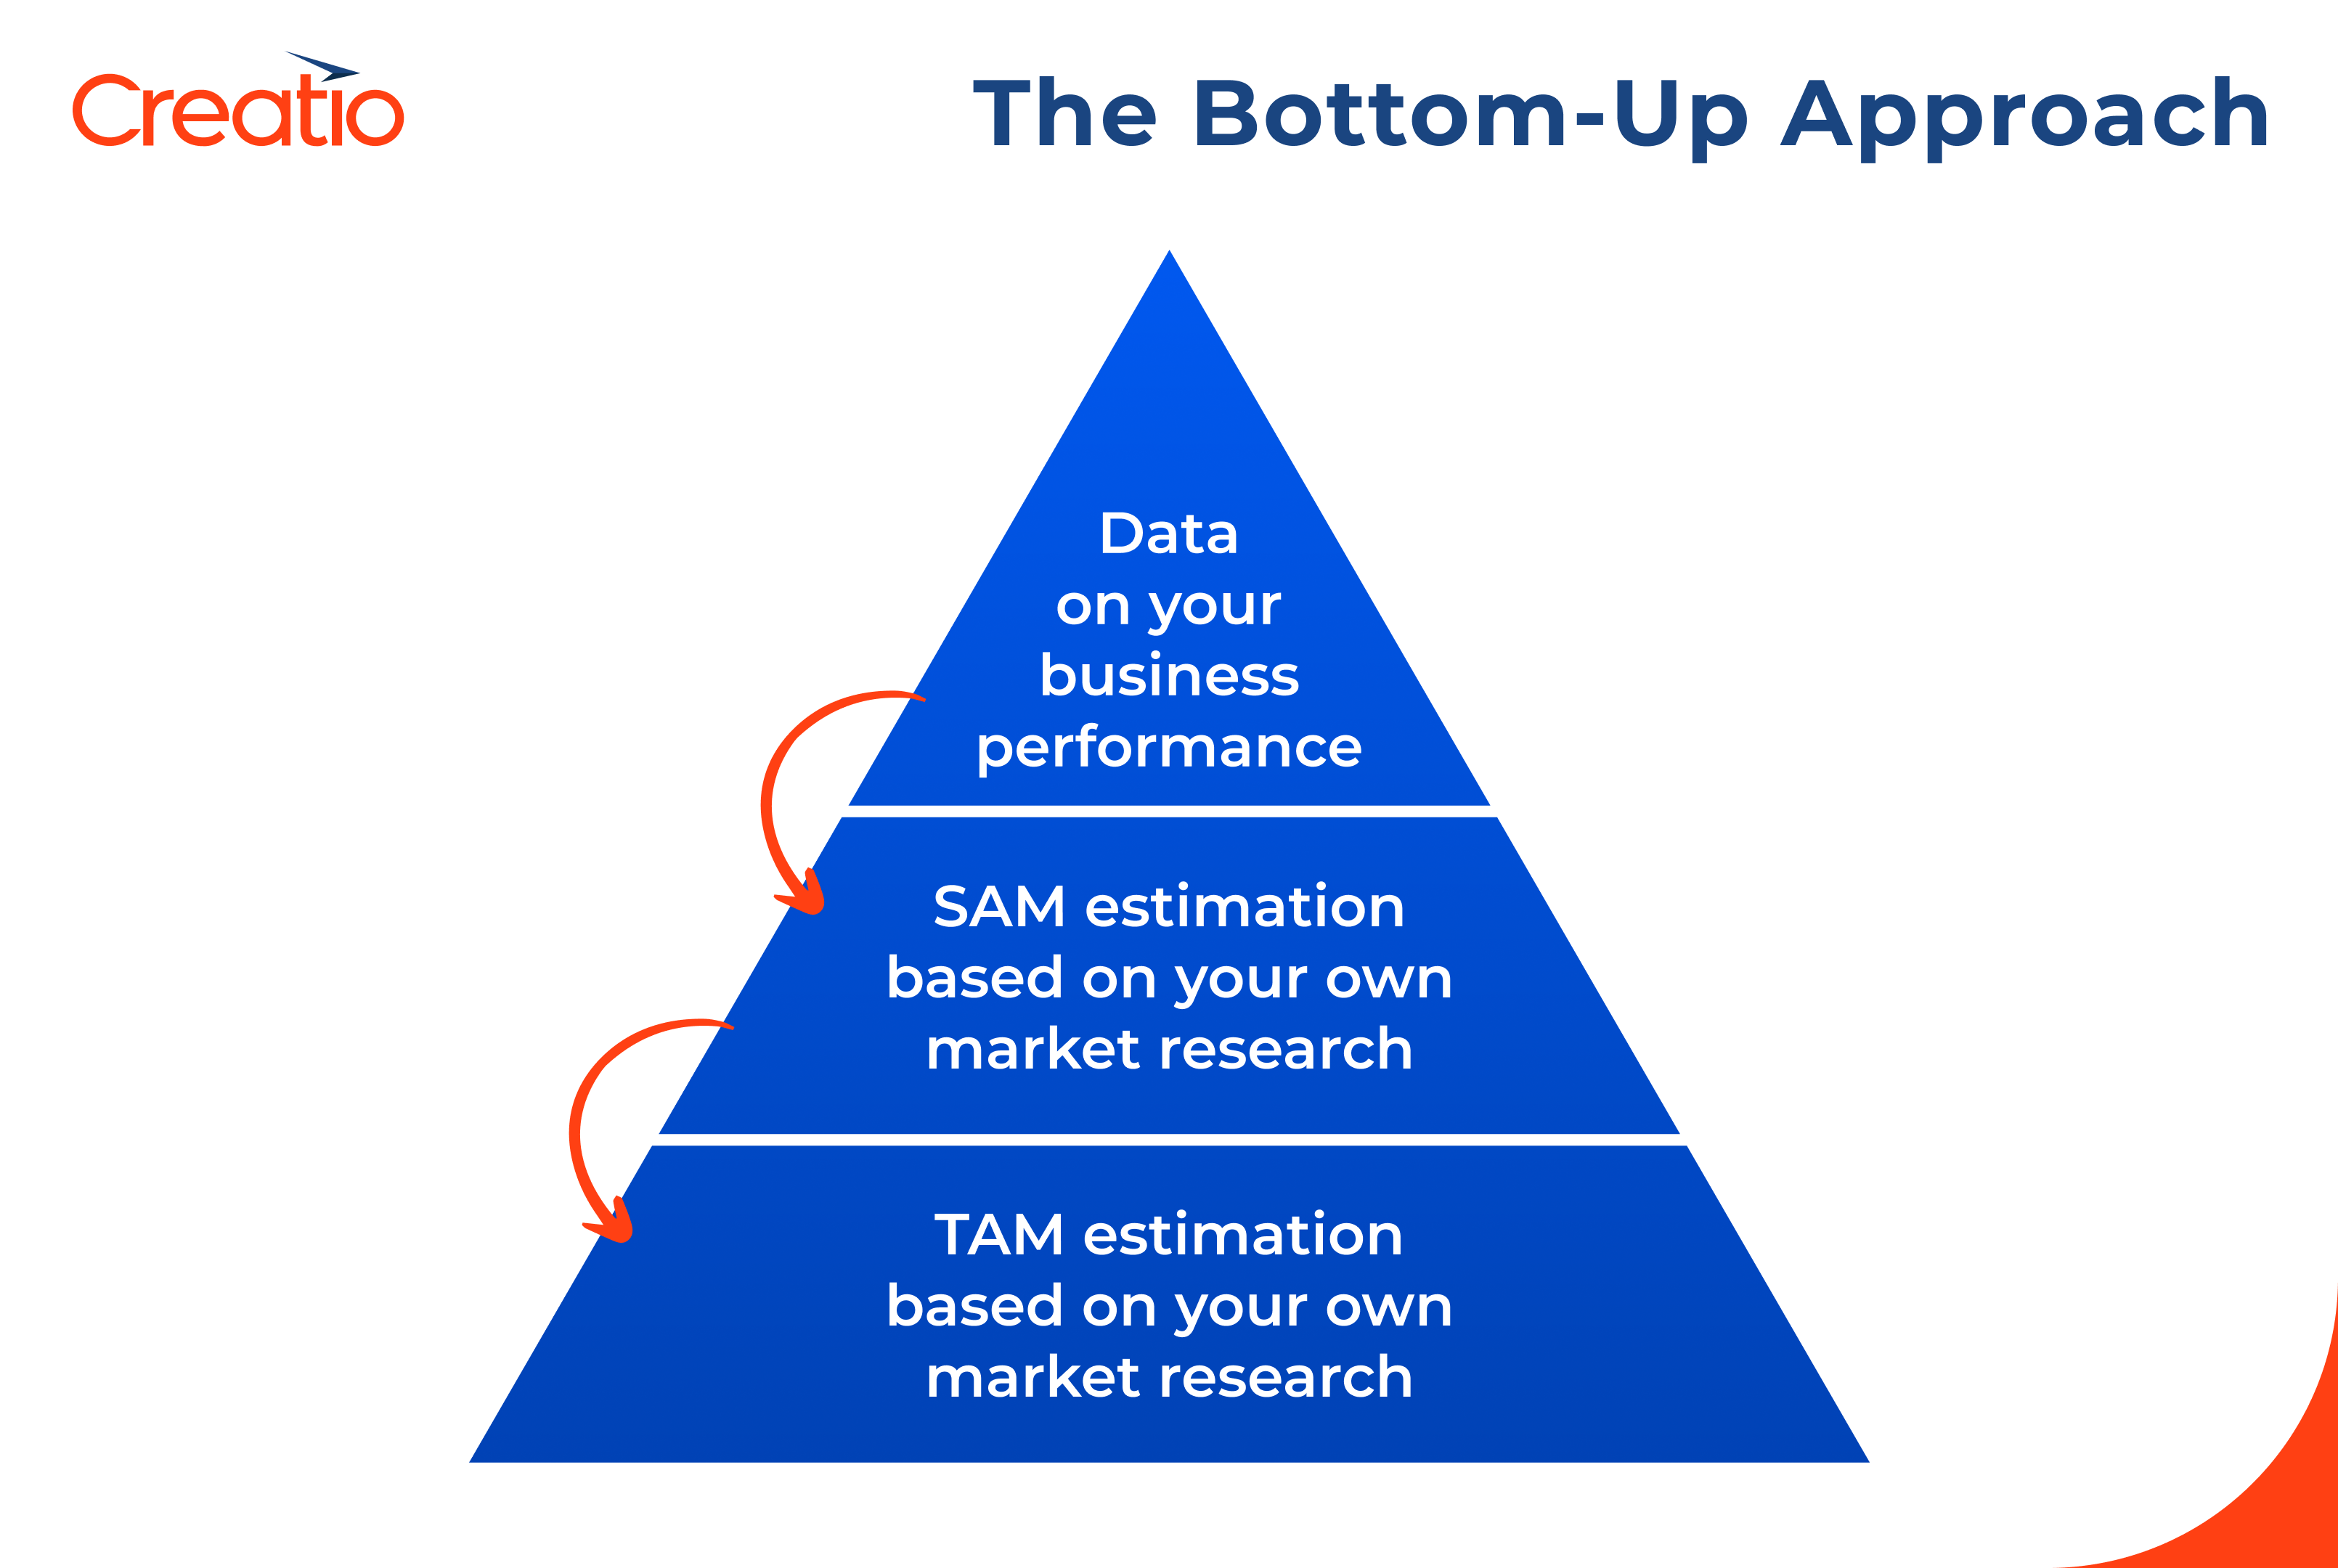
Alternatively, you can go for the bottom-up approach by doing your own research or getting a research crew involved. Here, you use your business data and specific market research to evaluate TAM, SAM, and SOM.
Then there’s the Value Theory Approach, good for innovative products without a clear market niche. For example, think about figuring out TAM for Facebook back in the late 2000s - a product with no direct analogues at the time. This approach means looking into how much consumers would fork out for the one-of-a-kind value your product brings.
The calculation follows the bottom-up approach, but instead of averaging sale prices, it involves looking at the price of a similar product and the extra your superior product could bring. While these calculations are a bit subjective and not as precise as traditional TAM assessments, they still help you to size up the whole market for your product.
On the other side, SOM is usually worked out after your company has gotten into the market and uses your own operational data. So, the methods mentioned earlier hardly ever apply to working it out.
Handy tools for calculating TAM, SAM, and SOM include industry reports, market research data, financial statements from publicly traded companies in your field, insights from industry gurus, and market research tools like social listening and online monitoring tools.
Now that we’ve got that down, let's dive into how each metric can be nailed down effectively.
TAM (Total Addressable Market) Calculation
When figuring out TAM, taking a top-down approach means diving into industry data, market reports, and research to size up markets and their segments. You then line up this info with your own business goals to gauge your TAM.
But these reports might not fit perfectly - they could be describing a similar but not exact market, or they might be out of date.
Bigger companies can splash out on new research or put an in-house team on the job for a bottom-up approach to TAM. Of course, startups with limited resources usually stick with the top-down method, which fits their needs better.
TAM Formula
No matter where you get your data from, the formula for calculating TAM stays the same:
Number of customers X Annual Revenue Per Customer
The customer count comes from market research, while yearly revenue is usually figured out using your own company’s data. If you don’t have that yet, you can also grab it from industry assessments.
TAM calculation example
Let's illustrate this with an example of calculating TAM for software designed to help financial institutions streamline thei KYC processes. Imagine there are hypothetically 25,000 financial institutions worldwide that could use this solution, each spending AUD 5,000 annually on KYC. So, our TAM would be calculated as: 25,000 X AUD 5,000 = AUD 125 million. This amount shows the total potential revenue if your software were adopted by every financial institution worldwide.
SAM (Serviceable Addressable Market) Calculation
When calculating SAM, you narrow down your analysis to get a practical idea of how much your product could actually sell.
Building on our earlier example, let’s say your KYC product has features that are especially appealing to credit unions rather than banks. While a few private banks might still be interested, the SAM calculation would mainly focus on how many credit unions are out there in the market.
SAM Formula
SAM=TAM×Percentage of the Market You Can Serve
SAM calculation example
According to Statista, there are approximately 60 credit unions in Australia that translates to 10% of all financial institutions. So, let's figure out SAM for our KYC software: AUD 125 million X 0.10% = AUD 12.5 million
SOM (Serviceable Obtainable Market) Calculation
SOM is usually worked out for businesses already established in the market with paying customers. To calculate it, you multiply your last year's market share by this year's SAM.
Your market share is affected by the competition you face. For example, if there are 5 major vendors of KYC software for financial institutions, with 4 offering special features for credit unions, you’ve sold AUD 500,000 worth of KYC software, your market share would be your last year's revenue divided by SAM i.e. AUD 500,000/AUD 12,5 mln =0,04 or 4% of the entire market.
If your revenue for the year tops your SOM, it shows you’ve successfully nabbed some of your competitors’ market share. Conversely, if your revenue falls short of SOM, it suggests your rivals are gaining ground, which means it’s time to reassess your product and go-to-market strategy.
If you’re planning to boost your market share next year with strategic moves, you can estimate your SOM based on the market share you aim to grab.
For companies looking to enter the market, figuring out SOM involves a Value Theory Approach. This means diving deep into consumer trends and behaviour to predict realistic revenue. You can also use the sales forecasting tools in your CRM software to help map out future earnings.
SOM Formula
SOM=SAM×Last Year's Market Share Percentage
SOM Examples
The SAM for our KYC software was AUD 12.5 mln. Multiplying this by the market share we calculated earlier, i.e. AUD 12.5 mln*0.04= AUD 500,000
Maximising Business Growth with TAM, SAM, and SOM Analysis
TAM, SAM, and SOM are powerful tools that drive business growth across various fronts, including exploring new markets, boosting investor confidence, and refining marketing and sales strategies. Here’s how these metrics (TAM, SAM, and SOM) are commonly applied:
- Spotting growth opportunities: TAM, SAM, and SOM help identify potential opportunities for growth within current markets or new ones.
- Validating product ideas: These metrics provide insights into market size and revenue potential, assisting in validation of new business ideas.
- Crafting a go-to-market strategy: By identifying promising market opportunities and defining target customers, TAM, SAM, and SOM help to shape effective go-to-market strategies.
- Attracting investors: Investors assess TAM, SAM, and SOM to assess investment potential. Demonstrating a substantial and expanding market opportunity through these metrics can attract investor interest.
- Tracking your progress: Use TAM, SAM, and SOM to track achievements in expanding within existing markets or entering new ones, setting benchmarks for business growth.
Calculate TAM SAM SOM for Strategic Growth
To sum it up, TAM, SAM, and SOM each serve specific roles in assessing market potential. SOM gives insight into short-term sales potential, SAM indicates the target market share you aim to capture, and TAM provides a broader view of potential market size. These metrics are crucial for validating your business idea and convincing stakeholders like investors or the company board to support it.
You can calculate TAM, SAM , and SOM using publicly available data or by conducting thorough market research. The calculations help uncover new market opportunities and refine your go-to-market strategy.
For a streamlined business approach that supports achieving SOM and capturing your SAM, consider using Creatio for business automation. It streamlines operations by automating routine tasks and consolidating all business data into a single platform.